HU | EN

Problems in the GIS evaluation of the Sopron settlement units

The archaeological site can be found in the north-western outskirts of Sopron (Hungary) at the Krautacker site, where a large-scale rescue excavation was conducted between 1973 and 1988 led by Dr. Erzsébet Jerem. The area excavated was over 20.000 sq m., where a multi-period riverside settlement and an adjacent cemetery were found. The site is situated on a plateau at an altitude of about 218 m, in a valley formed by Streams Ikva (Zeiselbach in German) and Liget between the Sopron and Ruszt Mountain Ranges.

At this site altogether 385 settlements were dug up and more than 180 graves were excavated. The evaluation of the materials of this important excavation and its publication is prepared within the framework of Hungarian-German scientific cooperation and supported by Áttekintő térképOTKA (Hungarian Science and Research Fund) and DAAD. Besides the Institute of Archaeology of the Hungarian Academy of Sciences, the Institutes of Prehistory of Marburg University and Berlin Freie University, as well as the Museum of Mining, Bochum are also taking part in the work which is to last for several years. Developing the GIS application, which was started 2 years ago, forms an important part of this project.

The GIS project consists of 2 tasks. The first one was to choose a uniform coordinate system for the maps and drawings of the GIS application. The project leaders decided on using the Gaus-Krüger projection system. So we scanned the topographical base map, transformed it into the Gaus-Krüger system, and finally digitised it. The altitude values were linked to contour lines and spot heights in the database, and thus it was fairly easy to generate various vector and raster surfaces, which clearly show the topographical forms of the settlement. The overall maps we found and the base points made us identify 3 different independent coordinate systems, which were used during the 15 years of the excavation. The different colours in slide show the 1, 5, and 10 m grids in the Gaus-Krüger projection system of the excavation coordinate grids.

The second task was to systematize and scan the drawings piled up during the 15 years of excavation and to transform them into the Gaus-Krüger projection system based on the excavation grids. We selected 210 drawings, which were mainly final drawings of the structures and sections. The drawings of the cemeteries are still waiting to be processed. When the final drawings were missing, we scanned the original object drawings made on squared scale paper used for fieldwork documentation. Then the transformed drawings were loaded into ErdaGIS. The GIS handles the drawings in such a way that it displays only those ones on the screen that are exactly in the examined area. This feature makes the digitising process highly efficient, which is supported by ErdaGIS with other functions as well. If you choose the object edge (which is objektum széle in the slide) it sets every feature e.g. layer, colour, style etc. necessary for digitization automatically. During this process, we mainly digitized the dug-up edge of the objects and their spot contours on different layers. In every object we placed a central text element, which is indeed the identification number of the object, to which its database table is linked. You can see it in the slide.

We filled in the object’s number (objektum száma in the picture) and its type (objektum típusa in the picture). At places we managed to load in the tables in two languages namely in Hungarian and in German. One of the most important future tasks is to ensure the bilingualism of the data of the GIS application.

We also included the date of the excavation. We developed the code table of the various archaeological periods for dating the objects. We gave the dating of the objects two values that is the earliest and the latest date. It is also possible to attach comments to a given object. The following fields enable us to register 4 types of different small finds that came to light from the given object. In the field "OTHER" (egyéb in the picture) you can make further comments about the finds. To fill in the fields called INVENTORY 1, 2 etc. (LELTÁR 1, 2 etc. in the picture) is a very important part of the work.

This makes it possible for you to link the catalogued, numbered, scanned object plans, sections, photos or other documents to the objects in the map. In order to do so, we developed a table that establishes connection between the two different identification systems that is between the catalogue number and the object number in the map.

You should fill in this table when you enter a new catalogued, numbered item into the GIS. When you finish recording, a synchronising program will establish the link between the two different identification systems. Then if you select an excavation object in the map, its digital documents, drawings, slides, descriptions etc. will be displayed from its database table. Here we applied the principle of using a model where we can store information about the object linked to the mapping place of its finding or preparation. Now we are loading in this system. In the past two years we have scanned and loaded in more than 300 plans and sections and more than fourteen-hundred (1400) slides. The plans of cemeteries and about 600 slides are still waiting to be scanned and loaded in. However, it is not yet the end. Any other documents can be entered the system later on. This solution has a great advantage. If you point to an object, the linked drawings, documents and picture can be displayed immediately.

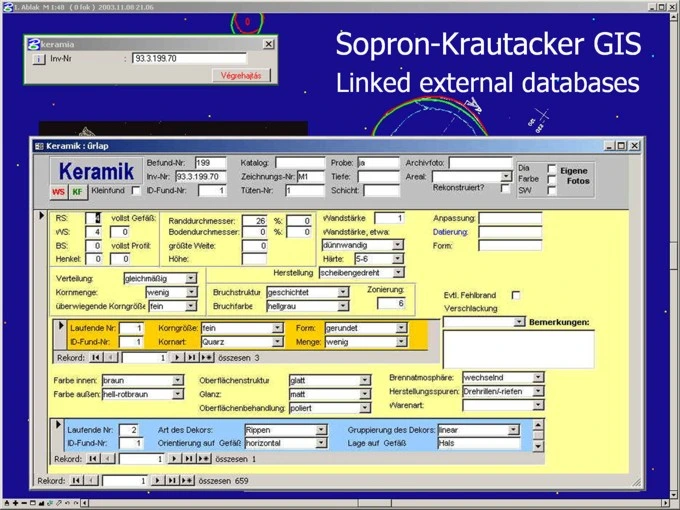
During the project, we also linked external databases. Like the GIS system, these databases were prepared in MS Access database management system. Their developers were Miss Franka Schwellnus, who is engaged in the complete procession of the objects (pottery and other small finds) of the late Hallstatt – early Celtic period, and Mr Manuel Zeiler, who is working on the finds of Celtic pottery kilns and waste-pits in their neighbourhood. Now you can make a query on objects, about which such a detailed analysis was prepared.

Moreover, if you type in an inventory number, the relevant object can be displayed with its internal and external database records. If you point to an object in the list, the system is able to display it immediately and thus you can study it internal and external database tables at the same time. If something is modified in the linked databases independent of the GIS, simply copy their Access files and thus you can update the GIS. There is an opportunity for further development that is to display the relevant map when an object is selected in an external database. This feature works in our other applications but so far it hasn’t been required here.

This is a coloured raster surface on the topography of the excavation. Blue denotes low-lying areas, green middle-lying areas, whereas orange high-lying areas. Red shows object contours.

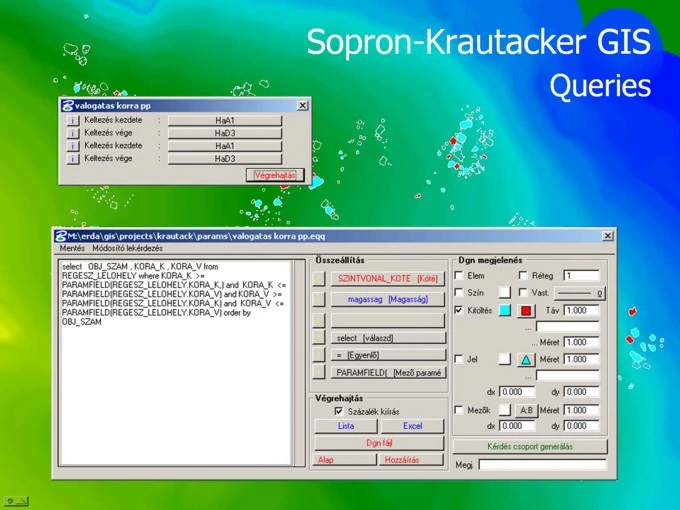
The previous area with a colourful topographic model and Halstatt objects. Blue colour denotes objects from Halstatt period only, while red shows objects belonging to Halstatt as well as to other periods. The following dialogue box made this query possible.

The SQL command entered generates a query dialogue box, which helps you to set the masking of the periods. This enables you to assemble query commands to your liking even if you’re not an IT expert. The queries can be saved in files, can be reloaded or even linked to push buttons etc. Afterwards, you can display the results in drawings, lists or Excel tables according to settings.

Of course, various queries and analyses are possible. I’ve been able to show you just a few of them.